There is no universal data-center water-use number. The result changes with the accounting boundary, cooling architecture, utilization, climate, source water, and operating mode.
The first useful answer is a transparent example. For a 100 MW (megawatt) site at 70% average utilization, this illustrative model estimates direct onsite consumption as follows:
WUE, or Water Usage Effectiveness, measures liters of direct site water per kilowatt-hour of IT energy. IT means the computing load from servers and related hardware. This table measures only water consumed at the site; it is not withdrawal, discharge, electricity-system water, or embodied water.
For a 100 MW (megawatt) site at 70% average utilization, this illustrative direct-onsite-consumption model gives:
| WUE (L/kWh) | Direct onsite water | Annual direct onsite water |
|---|---|---|
| 0.25 L/kWh | 110,952 gal/day | 40.50M gal/year |
| 0.50 L/kWh | 221,905 gal/day | 80.995M gal/year |
| 1.00 L/kWh | 443,809 gal/day | 161.99M gal/year |
One simple consistency check is useful:
- Reaching 1M gal/day at the same load/utilization implies about 2.25 L/kWh.
- Reaching 5M gal/day implies about 11.27 L/kWh.
Those higher values may be possible under different assumptions or boundaries. They do not describe the same direct-onsite-consumption model shown above, which assumes a WUE range of 0.25 to 1.00 L/kWh.
A scale check, not a verdict
Numbers this large are hard to picture. A competition-size pool measuring 50 meters by 25 meters with an average depth of 2 meters holds about 2.5 million liters, or 660,000 US gallons. Actual pool volumes vary with depth and design.
Using the same illustrative 0.50 L/kWh model above:
- A 40 kW rack uses about 336 liters, or 89 gallons, of direct onsite water per day.
- One pool is roughly 7,400 rack-days at that rack density and model assumption.
- The 100 MW site uses about one pool of direct onsite water every three days.
The aquarium comparison is about stored volume, not its water use or annual consumption. More broadly, these are volume equivalents, not impact equivalents. A pool, a zoo, a water park, and a data center can have very different water sources, return flows, seasonal patterns, and local constraints. The comparison makes scale visible; the basin still determines the risk.
The table is a useful starting point, not a universal benchmark. The boundary and assumptions have to travel with the number.
What the number means
Direct consumption is water lost to evaporation or otherwise not returned to the source watershed. Withdrawal is water taken from a source; some of it may be returned. Discharge includes blowdown and treatment reject. Indirect electricity-system water is associated with generating the site’s electricity. Embodied water covers manufacturing and construction.
Those ledgers are related, but they are not interchangeable:
| Ledger | What it measures |
|---|---|
| Direct onsite consumption | Water consumed by cooling and other site processes |
| Withdrawal | Water taken from a utility, river, reservoir, aquifer, or other source |
| Discharge and treatment reject | Blowdown, RO reject, and related wastewater streams |
| Indirect electricity-system water | Water associated with generating site electricity |
| Embodied water | Lifecycle water used for semiconductors, servers, buildings, and equipment |
This distinction matters because a withdrawal number can be much larger than consumption, while a direct site number can omit substantial upstream water. It also explains why two facilities with the same headline figure can face different environmental and infrastructure risks.
How cooling uses water
At a physical level, the chain is straightforward:
- IT equipment consumes electricity.
- Electricity becomes heat.
- Heat is moved from chip to rack to facility loop.
- Facility heat rejection determines direct water behavior.
Water usually appears most materially at the facility heat-rejection boundary, not as a direct feed to each server component.
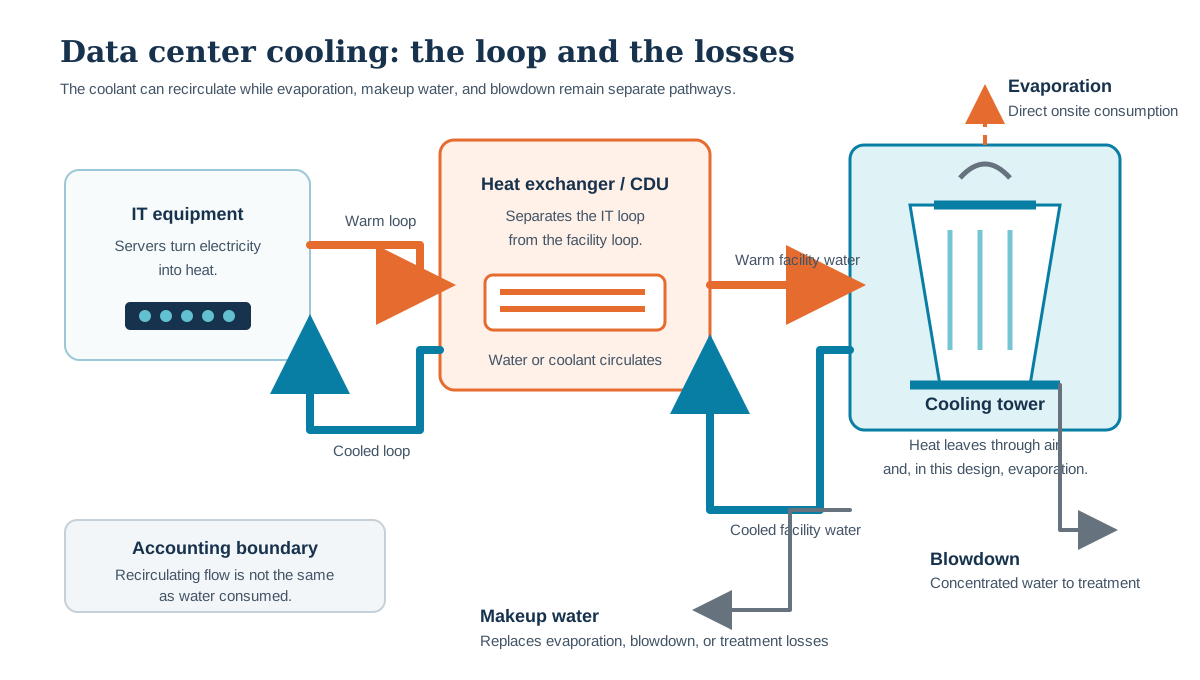
Original schematic. The facility loop can recirculate water or coolant while evaporation, blowdown, and makeup water remain separate accounting pathways.
IT equipment turns electricity into heat. Fans, cold plates, and coolant loops move that heat from chip to rack to facility systems. Heat rejection then determines whether the site uses evaporation, dry air, liquid cooling, or a hybrid approach. The facility loop can recirculate fluid many times; makeup water, evaporation, blowdown, and treatment reject are the distinct accounting pathways.
The diagram is the physical model behind the table. To understand risk, trace the water from source to treatment, cooling, discharge, evaporation, or return flow.
Why location changes the risk
The same volume can mean very different things in different basins. 100 ML in one location is not the same risk as 100 ML in another location.
Risk depends on watershed and source reliability, seasonal recharge, drought recurrence, groundwater trends, competing demand, and the timing, location, and quality of return flows. Return flow is not automatically equivalent to replenishment.
Consider two 100 MW facilities with identical annual direct water consumption. One sits in a basin with recurring drought restrictions and declining groundwater levels. The other operates in a water-abundant basin with stronger seasonal recharge and reclaimed-water availability. The ledger can be identical while the infrastructure risk is completely different.
Location changes the risk; design determines how much flexibility the facility has within it.
Does build year, retrofit depth, AI density, and location matter?
Yes. Strongly.
| Variable | Why it changes water | Directional effect |
|---|---|---|
| Build year and design generation | Newer designs are more likely to include updated cooling and controls | Can reduce direct onsite water intensity |
| Retrofit depth | Partial retrofit can optimize one subsystem while leaving source/discharge constraints intact | Mixed; often less impact than full redesign |
| AI/GPU rack density | Higher kW per rack concentrates heat rejection demand | Can raise peak cooling stress if architecture is not adapted |
| Cooling architecture | Evaporative, hybrid, dry, direct-to-chip, immersion have different water-energy profiles | Largest design lever |
| Climate and seasonality | Wet-bulb, humidity, heat waves, and drought alter operating mode | Large swing between average and peak-day demand |
| Source and utility constraints | Potable vs reclaimed, intake limits, discharge permits, sewer capacity | Can become the binding project constraint |
AI and GPU (graphics processing unit) density example at 70% utilization and 0.50 L/kWh:
| Rack nameplate power | Direct water per rack |
|---|---|
| 40 kW | 336 L/day |
| 80 kW | 672 L/day |
| 120 kW | 1,008 L/day |
Higher-density racks concentrate more heat in less space. That can force a different cooling architecture, which then changes direct water demand, electricity tradeoffs, and permitting requirements.
The water you save may reappear upstream
The design table points to an uncomfortable tradeoff. Dry or mostly dry cooling can reduce the water used at the facility, yet it may require more electricity during hot or demanding operating conditions. The power system supplying that electricity can have its own water footprint.
That means a reduction in direct onsite water is not automatically a reduction in total water impact. It may be a real improvement at the facility while shifting part of the burden to the electricity system.
Total water impact includes direct site water, water associated with electricity generation, and embodied water used to manufacture the equipment and buildings.
This article’s WUE calculation covers only direct site water. Dry cooling may reduce that term while increasing electricity demand, so the power system has to stay visible in the review.
The practical question is not whether dry, evaporative, or liquid cooling is universally best. It is which design produces the most defensible balance for this workload, this power system, and this basin.
Illustrative scenario results
We have now followed the water from source to cooling and seen how location and architecture change its meaning. The next question is what happens when capacity grows. A scenario model illustrates how growth and efficiency interact. These are derived outputs under stated assumptions, not measured facility, region, or operator inventory.
| Scenario | Annual direct consumption | Average daily direct consumption |
|---|---|---|
| 2026 modeled baseline | 11.59 GL/year | 31.75 ML/day; 8.39 MGD |
| 2030 modeled lower WUE | 13.49 GL/year | 36.96 ML/day; 9.77 MGD |
| 2030 modeled unchanged WUE | 19.47 GL/year | 53.34 ML/day; 14.09 MGD |
The scenario lesson is clear:
- Capacity growth can increase total demand even when efficiency improves.
- Efficiency still matters materially against the unchanged-WUE case.
- Build path and retrofit strategy are infrastructure decisions with hydrologic consequences.
Hard topics that should be in every serious review
-
Average versus peak-day reality Annual averages can hide risk during heatwave and drought concurrence.
-
Boundary mismatch Many public disagreements are accounting mismatches, not arithmetic errors.
-
Water-energy tradeoffs Direct-water reductions can shift burden upstream through power demand.
-
Discharge and chemistry constraints Blowdown handling, TDS (total dissolved solids) limits, RO reject, and sewer capacity can block expansion.
-
Governance and social license Permits, drought playbooks, and transparent accounting now influence project viability.
These are not separate footnotes. They are the conditions that determine whether a capacity plan works in the real world.
What to require before making a big capacity decision
That brings us back to the decision a project team actually has to make. A defensible water number needs both an architecture and a place. If a proposal cannot answer these questions, it is not decision-ready.
- Which basin and source supply this site?
- What is annual, peak-day, and dry-year demand?
- What cooling architecture is assumed at target rack density?
- What are direct consumption, withdrawal, and discharge separately?
- What limits exist on discharge chemistry and sewer treatment?
- What happens under drought-stage restrictions?
- Can planned expansion proceed without additional water rights or utility upgrades?
- Has power-water coupling been quantified for the selected architecture?
- What changed since original build date and what retrofits are complete versus planned?
- Which claims are observed, derived, or scenario?
If those answers are missing, the project may still be fundable. It is not yet explainable. The business impact usually appears in permitting delays, utility negotiations, expansion approvals, community opposition, cooling-architecture constraints, and long-term site-selection risk.
The future of AI infrastructure may be constrained by power, water, or permitting depending on location. The first step is making sure everyone is measuring the same thing.
Final take
The most quoted number in the AI water debate is often misleading without its boundary. Water use becomes a real infrastructure question only when the number is connected to a source, a basin, a cooling design, a power system, and a decision.
State the boundary before you state the number. That is how a headline debate becomes actionable infrastructure planning.
Sources
This article uses an operator-neutral framework built from public operator disclosures, independent research, policy analysis, utility publications, and national modeling. Relevant public sources include the LBNL 2024 United States Data Center Energy Usage Report, Ceres’ Drained by Data, the AWWA Cooling the Cloud white paper, the 2021 npj Clean Water study, and Google’s water stewardship disclosure.
The numerical examples in this article are illustrative calculations, not a global inventory or a claim about any single operator. Water figures should always be read with their metric, period, geography, and accounting boundary attached.